 Randall Stross just wrote this article for the New York Times, which essentially looks at the past 40 years of growth in spending in information technology.
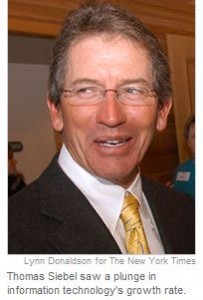
Stross points out that retired software executive Thomas Siebel, whose greatest fortune was won at the eponymously named software company he founded, points out key segments of that 40 year timeline, namely 1980 to 2000 and then from 2000 forward as the key times.
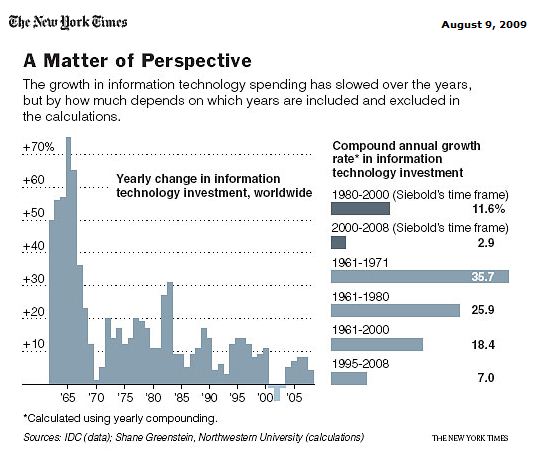
In a great graph, that unfortunately misspells Tom’s name, twice, I think both Siebel and Stross have missed the key point.
Looking at spending patterns as a compound annual growth rate (the so-called CAGR) as Siebel does, or slicing at specific blocks of time misses a critical piece of this data, the fact that innovations in technology and the ability of businesses to realize the potential of those innovations are reflected in the numbers.
In chapter 2 of Rethink, I walk through a series of big ideas in business, times when a truly different unit of analysis has been created, from Adam Smith’s “task” in the 1700s, to the “process” mostly made popular by Michael Hammer and James Champy in the early 1990s (with others in between, and one more at the end – the “what”).
Why this matters is that Hammer and Champy’s process transformed the way businesses looked at interdepartmental work, and that was what broke the dam on the popularity of ERP software, and that is the cause of the lump in this graph that begins in the mid-1990s. Then the internet took off, and crashed, but it left us with a flat world economy.
So there we were in a flat world economy, and then six years ago a technology architecture was introduced called Service Oriented Architecture (SOA) where technology could be built and managed like a series of lego building blocks. But the promise of SOA remains unfulfilled because businesses kept looking at their businesses with these old units of analysis, such as process. Even with that limitation, another lump emerged with a strong economy.
SOA has matured with the internet and the latest label is “cloud” computing, and there are internal clouds and external clouds and terms like “SaaS” for software-as-a-service, and “S+S” for software-plus-services (suggesting some software needs to remain on your desktop and some of it should be in the cloud, or at least, “a” cloud).
So what does this have to do with Tom Siebel and the graph in this article by Randall Stross? Just as the process lens unleashed the ERP software wave in the mid-1990s, the “what” lens in the pages of Rethink has the ability to unlock the potential of cloud computing and we should expect to see another big lump on this graph as we move into the years to the right.
And I will bet you a dollar that I am right.
-Ric
Ric,
I want to make this really clear. New ways of building and deploying software, plus infrastructure on demand (internally and externally), plus a capability (or “what” based) understanding of your business model have broken the model.
Everyone is aware of Moore’s Law. We are currently seeing the economic result of this. Through identifying, focusing, prioritizing, and scoping technology investments leveraging the new environment we can drive substantially greater benefit for a fraction of the cost. Hence the current lower investment curve.
Business is starting to realize that we can reliably deliver on this promise. Smart companies will increase their investment to create great distance between them and their competition.