Every year at around this time, there’s an article in The New York Times listing the highest paid CEOs in public companies. This year Peter Eavis wrote the article “It’s Never Been Easier to be the Boss” talking about the skyrocketing pay of CEOs in the updraft from a strong stock market and “strong economy.” The article points out that median pay among the top 200 was $18.6 million, up 6.3% from the prior year (the comparison was 2018 vs. 2017). A few key people were not on the list – the Uber CEO would have made the list with more than $100 million in total compensation but Uber wasn’t public until this year, so that disqualified that one. Jeff Bezos probably dwarfed the #1 most highly compensated CEO (Elon Musk from Tesla at $2.284 billion, ahead of the #2 from Discovery at $129 million) but he already owns 16% of Amazon and does not get new stock awards – so he isn’t on this list either.
As usual, it reads a bit like a salary list from the NFL, NBA, or MLB where the numbers are so big, it borders on silly. By the way the highest paid player in the NBA, Steph Curry will make $34 million this year, which is almost double the median salary of these public company CEOs.
Eavis did hint at the fact that the #1 job of a public company CEO is to deliver shareholder value, but did not comment much on the fact that many of these highly paid CEOs were in the red when it came to delivery of shareholder value. Seeing the stock down a per cent or two would not be so surprising, but several of these CEOs were into the red in double digits which is pretty amazing.
So I decided to do something with the numbers that Peter Eavis did not do.
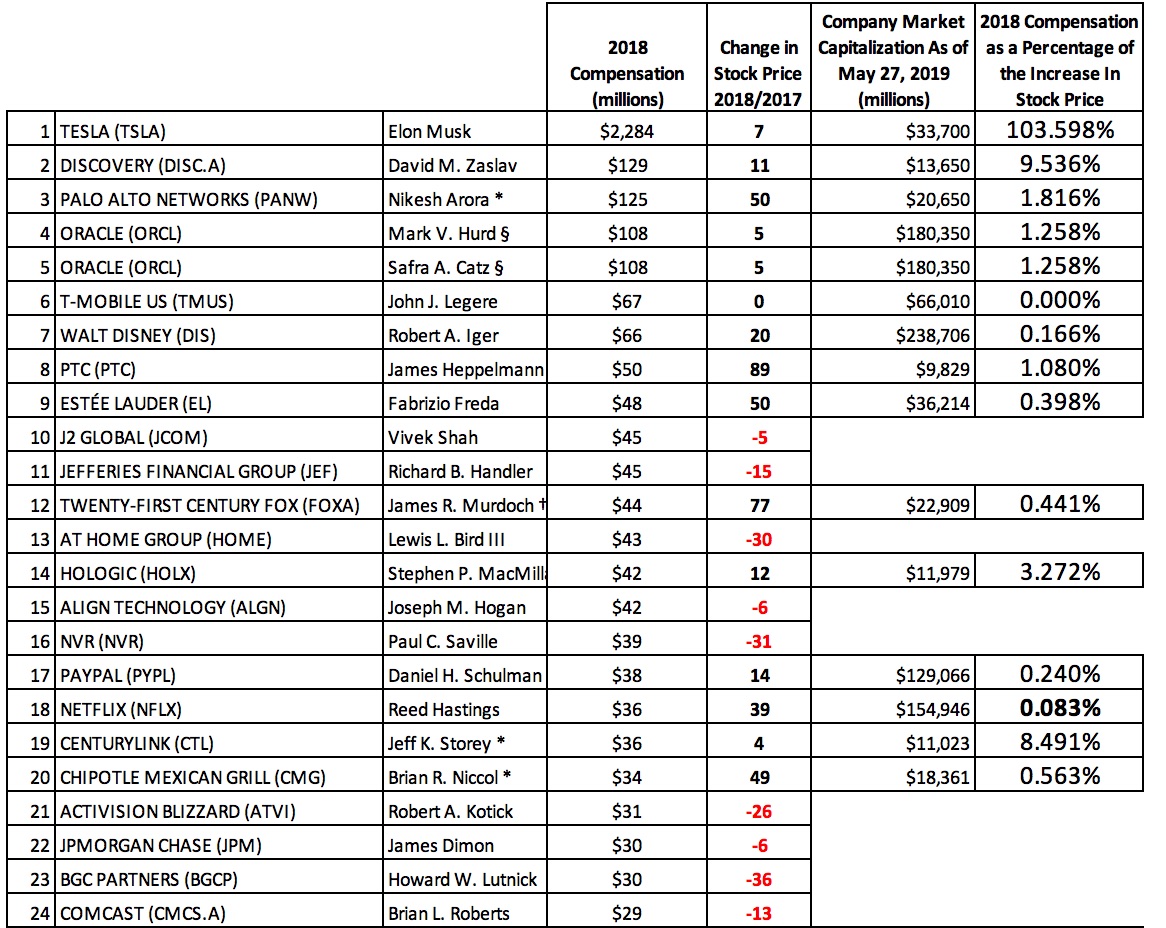
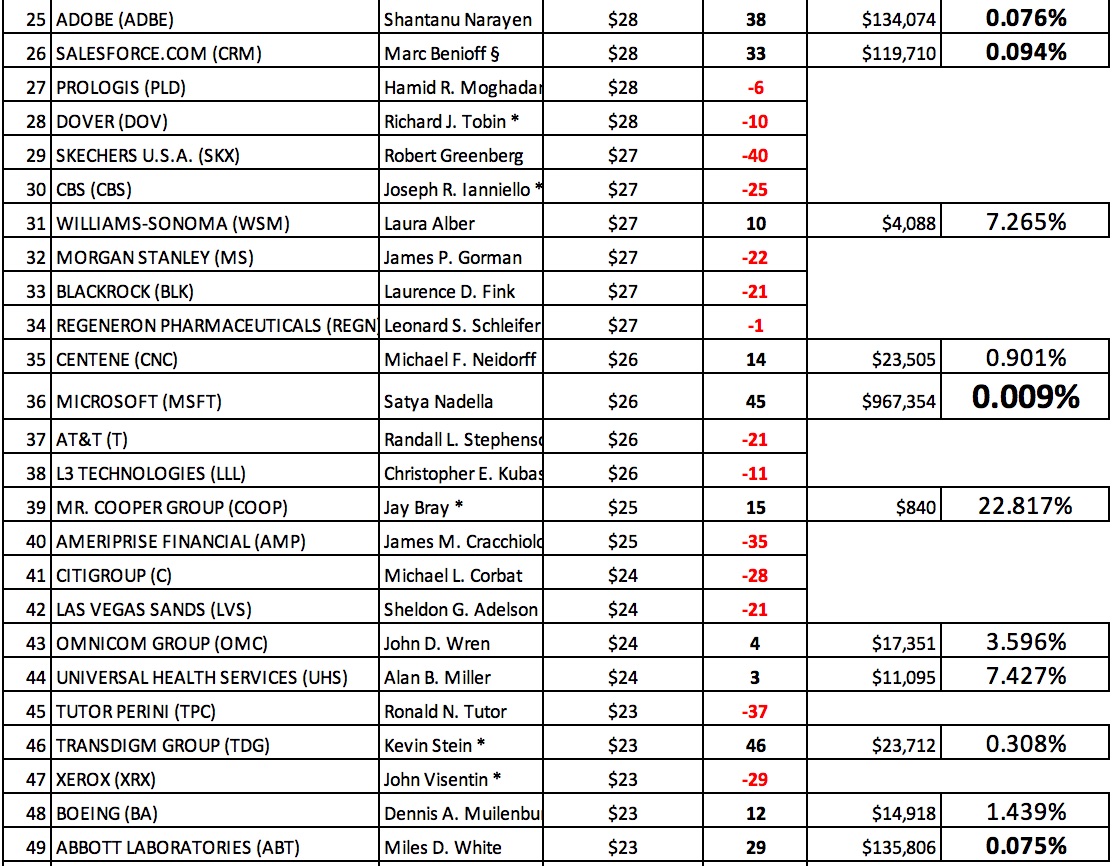
Eavis did (in the print version) indicate the change in stock performance of the company year-over-year, but it was way off to the right and seeing that a few were negative did not pop out at me when I read them. When I put them into a spreadsheet, I colored the negative ones red. I took the market capitalization of the company as of May 27, and I am pretty sure Eavis did it as of the end of 2018, so this is an imperfect set of data, but even with that asterisk, some of these numbers are pretty shocking.
I thought would be interesting to see how the CEO compensation mapped to the change in Market Cap of the company – since delivering shareholder value is their #1 job.
What I did was take the increase in stock price (per cent) and calculate the Market Cap value of that increase. So looking at the first one – Tesla’s stock was worth $33.7 billion yesterday, a 7% increase in that is $2.204 billion. Elon Musk’s 2018 compensation is 103.598% of the value of the increase in their Market Cap. So scanning the list, it’s pretty common for the compensation of the CEO to be around a per cent or two of the increase in shareholder value, and that seems to make some sense.
A couple of things were most shocking in this analysis:
- Most companies lost value. You’d think that the top 200 highest paid CEOs all delivered shareholder value and that’s why they made the list. Nope. For the top 75 highest paid CEOs, 38 of the companies or 50.7% were in the red for change in stock price in 2018. That’s really incredible.
- Some of the best CEOs had the smallest compensation relative to delivery of shareholder value. It’s no secret that Microsoft and Apple have done incredibly well in the stock market and many people give credit to their CEOs. If you scan down to #36 on the list, you will find Microsoft CEO Satya Nadella at $26 million, which is .009% of the value of how much their stock has gone up. Apple’s CEO Tim Cook ended up 136th on the list with $16 million, which is just .006% of how much shareholder value was delivered.
You will notice some of the smaller percentages on the right are in bold.
Moneyball is a book and a movie highlighting that Major League Baseball was using batting average as the #1 statistic for choosing their players, when it turns out that On Base Percentage is a better indication of whether a player will help them win baseball games. I think the way the numbers are organized below should raise some questions about whether these CEOs should be getting as much as they are – in the context of how much shareholder value they are delivering. It seems like the CEOs who delivered the most shareholder value should be paid much more – and the 50.7% that delivered negative shareholder value should call a meeting with their compensation committee. . .


Leave a Reply